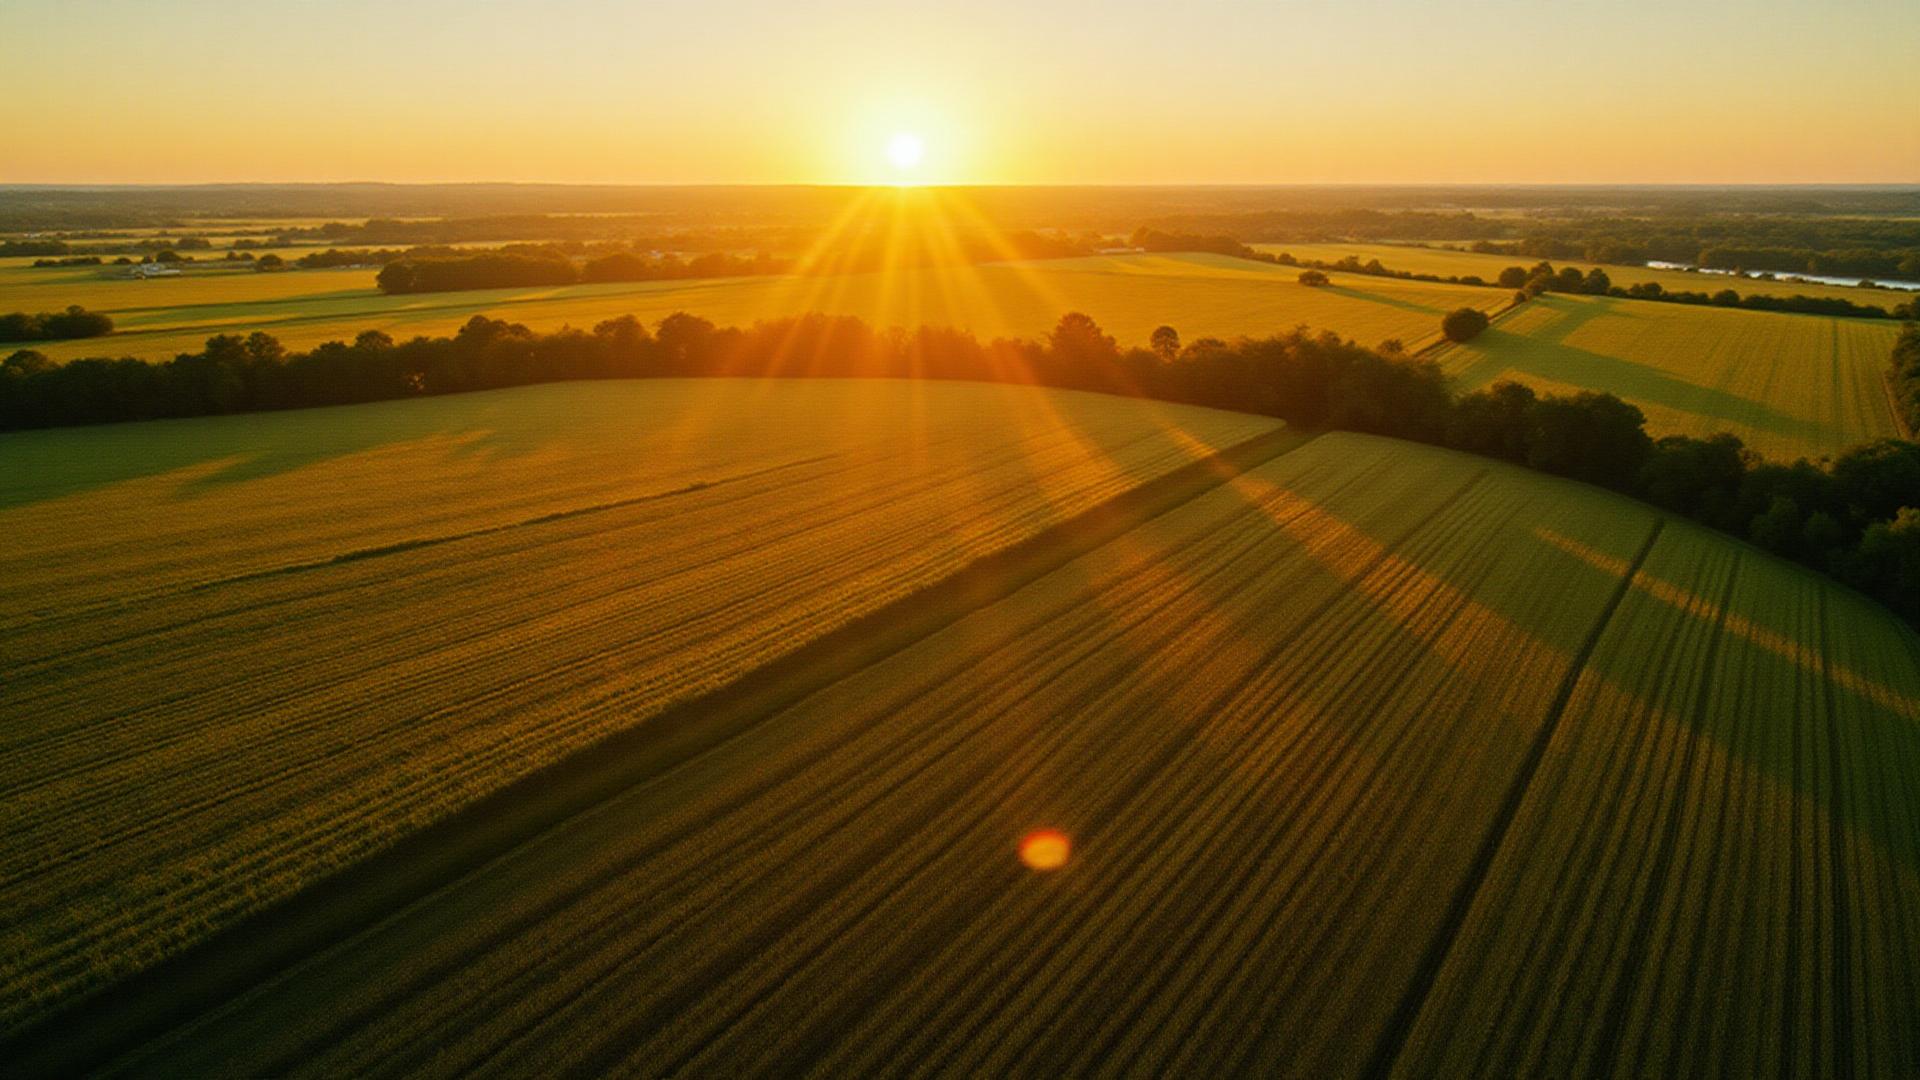
The 2026 USDA NASS Land Values release puts the national average US farmland price at $4,520 per acre, up +3.9% year over year and a fresh all-time high. Cropland now averages $5,460 per acre and pastureland $1,790, both setting new records as well.
For landowners, the headline is simple: nearly every contiguous state hit a new peak in 2026. The numbers below break that down state by state, including 2024 and 2025 baselines so you can see exactly how your market has moved.
State-by-State Farmland Prices (2024–2026)
Average farmland value per acre, all 48 contiguous states. Source: USDA NASS Land Values reports plus regional Federal Reserve farmland surveys for 2026 estimates. Updated quarterly.
| State | 2024 Avg $/Acre | 2025 Avg $/Acre | 2026 Avg $/Acre | YoY Change | 3-Yr Change |
|---|---|---|---|---|---|
| Alabama | $4,150 | $4,290 | $4,430 | +3.3% | +6.7% |
| Arizona | $7,400 | $7,560 | $7,720 | +2.1% | +4.3% |
| Arkansas | $3,850 | $3,970 | $4,090 | +3.0% | +6.2% |
| California | $12,800 | $13,150 | $13,520 | +2.8% | +5.6% |
| Colorado | $1,850 | $1,920 | $1,990 | +3.6% | +7.6% |
| Connecticut | $13,500 | $13,800 | $14,080 | +2.0% | +4.3% |
| Delaware | $9,300 | $9,550 | $9,810 | +2.7% | +5.5% |
| Florida | $7,050 | $7,280 | $7,510 | +3.2% | +6.5% |
| Georgia | $4,450 | $4,620 | $4,790 | +3.7% | +7.6% |
| Idaho | $4,150 | $4,290 | $4,430 | +3.3% | +6.7% |
| Illinois | $9,200 | $9,520 | $9,850 | +3.5% | +7.1% |
| Indiana | $7,950 | $8,200 | $8,460 | +3.2% | +6.4% |
| Iowa | $9,800 | $10,150 | $10,510 | +3.5% | +7.2% |
| Kansas | $2,580 | $2,680 | $2,780 | +3.7% | +7.8% |
| Kentucky | $4,980 | $5,140 | $5,310 | +3.3% | +6.6% |
| Louisiana | $3,300 | $3,410 | $3,520 | +3.2% | +6.7% |
| Maine | $2,750 | $2,830 | $2,910 | +2.8% | +5.8% |
| Maryland | $8,500 | $8,730 | $8,970 | +2.7% | +5.5% |
| Massachusetts | $12,400 | $12,680 | $12,950 | +2.1% | +4.4% |
| Michigan | $5,450 | $5,620 | $5,790 | +3.0% | +6.2% |
| Minnesota | $5,750 | $5,940 | $6,140 | +3.4% | +6.8% |
| Mississippi | $3,550 | $3,680 | $3,810 | +3.5% | +7.3% |
| Missouri | $4,480 | $4,640 | $4,810 | +3.7% | +7.4% |
| Montana | $1,080 | $1,120 | $1,160 | +3.6% | +7.4% |
| Nebraska | $4,180 | $4,330 | $4,490 | +3.7% | +7.4% |
| Nevada | $980 | $1,010 | $1,040 | +3.0% | +6.1% |
| New Hampshire | $5,400 | $5,560 | $5,710 | +2.7% | +5.7% |
| New Jersey | $14,800 | $15,120 | $15,440 | +2.1% | +4.3% |
| New Mexico | $580 | $600 | $620 | +3.3% | +6.9% |
| New York | $3,650 | $3,760 | $3,870 | +2.9% | +6.0% |
| North Carolina | $5,500 | $5,680 | $5,870 | +3.3% | +6.7% |
| North Dakota | $2,630 | $2,730 | $2,830 | +3.7% | +7.6% |
| Ohio | $7,800 | $8,050 | $8,310 | +3.2% | +6.5% |
| Oklahoma | $2,280 | $2,360 | $2,440 | +3.4% | +7.0% |
| Oregon | $3,450 | $3,560 | $3,680 | +3.4% | +6.7% |
| Pennsylvania | $7,600 | $7,820 | $8,040 | +2.8% | +5.8% |
| Rhode Island | $14,200 | $14,500 | $14,790 | +2.0% | +4.2% |
| South Carolina | $3,900 | $4,030 | $4,170 | +3.5% | +6.9% |
| South Dakota | $2,780 | $2,880 | $2,980 | +3.5% | +7.2% |
| Tennessee | $5,200 | $5,380 | $5,560 | +3.3% | +6.9% |
| Texas | $2,850 | $2,960 | $3,070 | +3.7% | +7.7% |
| Utah | $2,350 | $2,430 | $2,510 | +3.3% | +6.8% |
| Vermont | $3,650 | $3,760 | $3,870 | +2.9% | +6.0% |
| Virginia | $5,350 | $5,520 | $5,700 | +3.3% | +6.5% |
| Washington | $3,550 | $3,670 | $3,790 | +3.3% | +6.8% |
| West Virginia | $3,250 | $3,350 | $3,450 | +3.0% | +6.2% |
| Wisconsin | $5,650 | $5,830 | $6,020 | +3.3% | +6.5% |
| Wyoming | $820 | $850 | $880 | +3.5% | +7.3% |
Top 10 States by Farmland Price (2026)
The Northeast and California still hold the top spots, with the Corn Belt's Iowa and Illinois right behind.
Why Are Farmland Prices at Record Highs?
Three forces are stacking on top of each other in 2026. First, supply keeps shrinking — the US loses farmland every year to development, solar leases, and conservation. Second, institutional money continues to treat farmland as one of the cleanest inflation hedges available, and pension funds and family offices remain net buyers. Third, productivity per acre keeps climbing thanks to precision ag, which lets buyers justify higher prices on the same ground.
Strong commodity prices through late 2025 helped, too. Cattle prices in particular set their own records, pulling pastureland values along for the ride. Add in still-tight rural housing supply and you have a market where the bidder pool keeps growing while the inventory stays flat.
Regional Breakdown: Midwest vs South vs West
Midwest
Iowa, Illinois, Indiana, and Ohio are still the heart of US row-crop value. Top-quality Iowa cropland trades well above the state average, with premium parcels crossing $20,000 per acre in 2026. YoY gains of 3–4% are smaller than 2022's surge but remain firmly positive.
South
Georgia, Tennessee, Kentucky, and the Carolinas continue to climb on the back of timber, livestock, and recreational demand. Florida holds its premium thanks to specialty crops and development pressure. The South has been one of the most consistent appreciation regions over the last three years.
West
California sits in a class of its own — irrigated specialty-crop ground keeps it at the very top of US averages. Mountain West states like Wyoming, Montana, and New Mexico stay low because most of the acreage is rangeland, but per-parcel premiums on irrigated meadows have grown sharply.
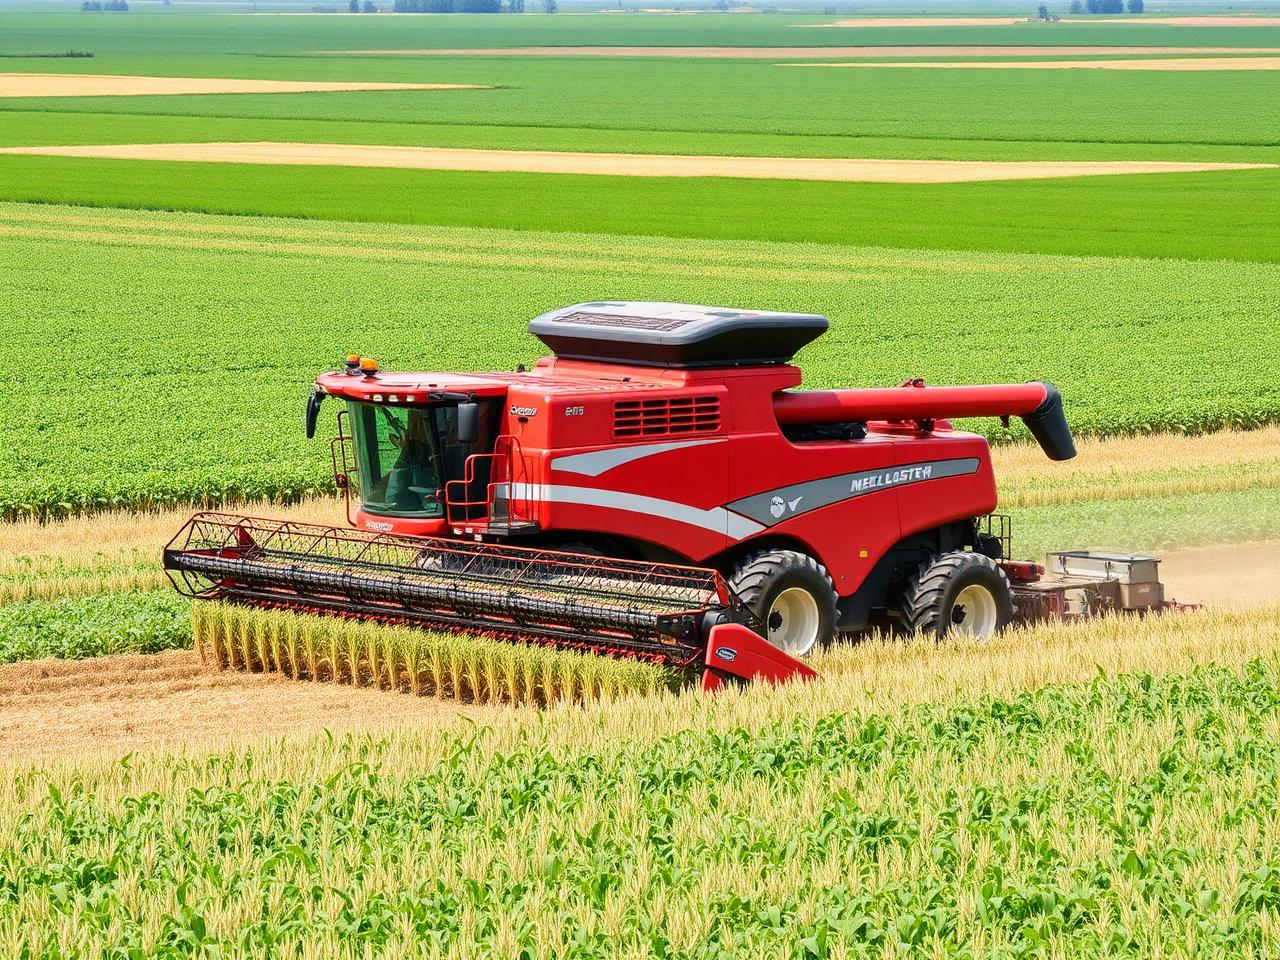
Modern agricultural operations drive productivity and land values higher
Record-Breaking Numbers Tell a Complex Story
The USDA National Agricultural Statistics Service report paints a picture of agricultural land that continues to appreciate despite headwinds that would normally suppress prices. The 4.3% year-over-year increase in average farmland values represents not just inflation catching up, but genuine demand pressure from multiple sources.
Cropland, the most productive and sought-after agricultural real estate, now commands an average of $5,250 per acre—a figure that would have seemed astronomical just a decade ago. This category includes prime corn and soybean ground in the Midwest, high-value specialty crop land in California, and productive wheat fields across the Plains states. The steady climb reflects both improved farming technology that squeezes more yield from each acre and institutional investor appetite for hard assets with predictable returns.
Meanwhile, pastureland—traditionally valued lower due to its less intensive use—hit $1,700 per acre. While this represents significant appreciation, the gap between cropland and pasture values continues to widen, signaling market differentiation based on productivity potential and water rights availability.
What's Driving These Values?
Institutional Investment Surge
Farmland has become increasingly attractive to pension funds, endowments, and high-net-worth individuals seeking inflation hedges. Unlike volatile stock markets, agricultural land offers tangible value and consistent returns through lease income. Major institutional players have poured billions into U.S. farmland over the past five years, treating it as a portfolio diversification strategy and long-term wealth preservation vehicle.
Limited Supply Meets Steady Demand
The United States isn't making more farmland—in fact, prime agricultural acres continue to be lost to urban development, conservation easements, and renewable energy projects like solar farms. This shrinking supply combined with growing domestic and international food demand creates upward pressure on values. Farmers expanding operations and investors seeking trophy properties compete for the same finite resource.
Technological Improvements and Productivity Gains
Modern precision agriculture technology—GPS-guided equipment, variable rate application, drone monitoring, and data analytics—has dramatically increased per-acre productivity. Buyers recognize that today's farmland can produce significantly more than the same parcel could a generation ago, justifying higher purchase prices based on improved return potential.
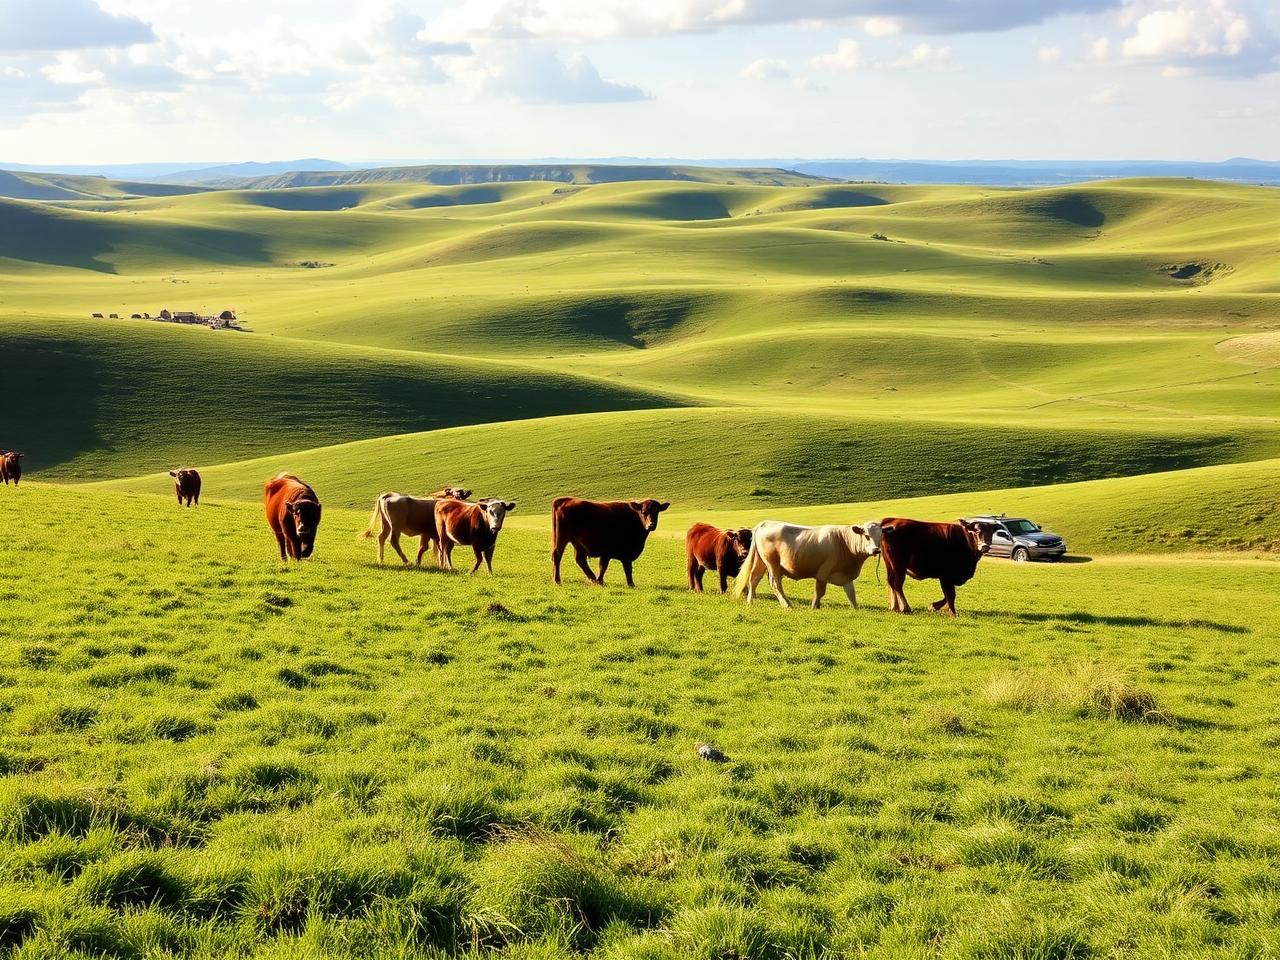
Pastureland values hit $1,700 per acre, reflecting strong demand for grazing operations
The Trade Uncertainty Factor
These record land values arrive at a particularly uncertain moment for American agriculture. The Trump administration's renewed focus on tariffs and trade renegotiations creates anxiety throughout farm country. Agricultural exports—particularly soybeans, corn, pork, and beef—depend heavily on established trade relationships with China, Mexico, Canada, and other major partners.
Many farmers remember the trade war of 2018-2019, when retaliatory tariffs devastated soybean exports and required billions in emergency government payments to keep operations afloat. While farmland values continued to appreciate during that period, commodity prices suffered, squeezing operating margins and forcing some producers to sell.
The current valuation surge suggests that investors and buyers are betting either on stable trade policy or their ability to weather short-term disruptions. However, this optimism creates vulnerability—if commodity prices crater due to trade restrictions while land values remain elevated, the gap between asset value and operational profitability could widen dangerously.
Regional Variations Paint Different Pictures
While national averages tell one story, regional markets show significant variation. The Corn Belt states—Iowa, Illinois, Indiana—continue to command premium prices, with top-quality ground sometimes exceeding $15,000 per acre in areas with excellent soils, drainage, and access to markets. These regions benefit from established infrastructure, proven productivity, and buyer competition.
California's specialty crop land operates in its own category, with irrigated acreage in premium growing regions fetching astronomical prices driven by permanent crop plantings, water rights, and proximity to major population centers. Conversely, dryland wheat country in the Great Plains and rangeland in the Mountain West typically trade below national averages, though recent years have seen appreciation even in these traditionally lower-value markets.
Southern states like Georgia have experienced steady appreciation as well, with diverse agricultural uses—timber, row crops, livestock—creating multiple buyer pools. Landowners looking to capitalize on peak values may find this an opportune moment to sell Georgia land fast while demand remains strong and uncertainty about future policy looms.
What This Means for Land Sellers
If you're thinking about selling, 2026's record prices are doing the heavy lifting for you. Before you list or call a buyer, it's worth running your specific parcel through a free land value calculator so you have a real number — not just a state average — going into any conversation.
The Selling Window
For landowners considering a sale, current market conditions present an attractive opportunity. Record values mean maximum return on what is likely your most valuable asset. However, timing matters—if trade disruptions materially impact commodity prices or if interest rates continue to fluctuate, buyer appetite could cool. The combination of peak values and multiple buyer types (farmers, investors, developers) creates seller-friendly dynamics that may not persist indefinitely.
The Holding Decision
Conversely, landowners holding for legacy or long-term investment purposes benefit from continued appreciation and inflation hedging. Agricultural land historically preserves wealth across generations better than most asset classes. However, elevated values also mean higher property tax assessments in many jurisdictions and increased carrying costs that must be weighed against appreciation potential.
Cash Flow Considerations
Many landowners rent their ground to operating farmers. While land values hit records, cash rent rates have not kept pace proportionally. This creates a yield compression—you're paying more per acre to acquire farmland while rental income as a percentage of purchase price declines. Operating farmers face similar math: buying at $5,250 per acre means higher capital costs that must be offset by strong commodity prices to maintain profitability.
Frequently Asked Questions
What is the most expensive farmland in America?
On a per-acre basis, New Jersey, Rhode Island, Connecticut, and California top the 2026 USDA NASS rankings, with averages above $13,000 per acre. The single most expensive parcels are typically irrigated specialty-crop ground in California's Central Valley and Salinas Valley, where permanent crops and water rights push prices well past $40,000 per acre.
Are farmland prices still rising in 2026?
Yes. National average farmland values rose roughly 3–4% year-over-year heading into 2026, with the strongest gains in the Corn Belt and parts of the Southeast. Growth has slowed compared with the 7–10% jumps of 2022–2023 but remains positive in nearly every state.
Will farmland prices crash?
A sharp crash is unlikely in the near term. Farmland supply continues to shrink as acres are lost to development, while institutional demand and inflation hedging keep buyer interest steady. The bigger risk is a slowdown in price growth — not a collapse — if commodity prices weaken or interest rates stay elevated.
Which state has the cheapest farmland?
New Mexico, Wyoming, and Nevada have the lowest average per-acre farmland values, generally under $1,100 per acre. Most of this acreage is non-irrigated rangeland used for grazing rather than row crops.
How much has farmland appreciated over 3 years?
From 2024 to 2026, the national average farmland value rose roughly 6–8%, with Midwest cropland states (Iowa, Illinois, Indiana) seeing 7–9% gains. Pastureland in the Mountain West has appreciated more slowly, in the 4–6% range.
Is now a good time to sell farmland?
For most owners, 2026 still offers strong sale conditions. Values are at or near record highs in nearly every state, buyer demand from both farmers and investors remains active, and waiting for further appreciation carries real risk if commodity prices or interest rates shift. A free land valuation is the fastest way to see what your specific parcel is worth today.
Looking Ahead: Sustainability or Bubble?
The fundamental question facing agricultural real estate is whether current valuations represent sustainable market equilibrium or a speculative bubble waiting to deflate. Several factors suggest these prices have staying power: farmland supply continues to shrink, global food demand trends upward, and institutional money seeking inflation protection and ESG-compliant investments shows no signs of retreating.
However, risks remain. Climate change creates production uncertainty in traditional growing regions. Water availability issues in the West threaten to reshape agricultural geography. Policy shifts—from trade to taxation to environmental regulation—could rapidly alter investment calculus. And most significantly, if commodity prices crash while land values stay elevated, the disconnect between asset values and operational returns could force market corrections.
The next 12-24 months will prove critical. If the Trump administration's trade policies avoid triggering retaliatory tariffs, if commodity prices remain stable or strengthen, and if interest rates moderate, farmland values could continue their ascent. Alternatively, simultaneous pressures from multiple directions—trade wars, rate hikes, severe weather, policy uncertainty—could finally crack the market's confidence.
The Bottom Line
U.S. farmland hitting $4,350 per acre represents both opportunity and caution. For sellers, these record values offer maximum returns in an uncertain economic landscape. For buyers—whether farmers expanding operations or investors diversifying portfolios—the decision requires careful analysis of risk versus long-term potential.
What's clear is that American agricultural land remains one of the most sought-after and resilient asset classes in an increasingly volatile world. Whether that resilience can withstand coming trade uncertainties and economic pressures will determine if today's record prices mark a sustainable peak or the top of an unsustainable bubble. For now, farmland owners hold a valuable card—but timing when to play it may prove as important as the land's intrinsic worth.